Today
-
Zoom link: https://ucla.zoom.us/j/529735962.
-
Neural network (cont’d).
-
Course evaluation. http://my.ucla.edu
Shiny app showcase:
All of you did a great job in HW3. A few samples:
Checklist on your resume/cv
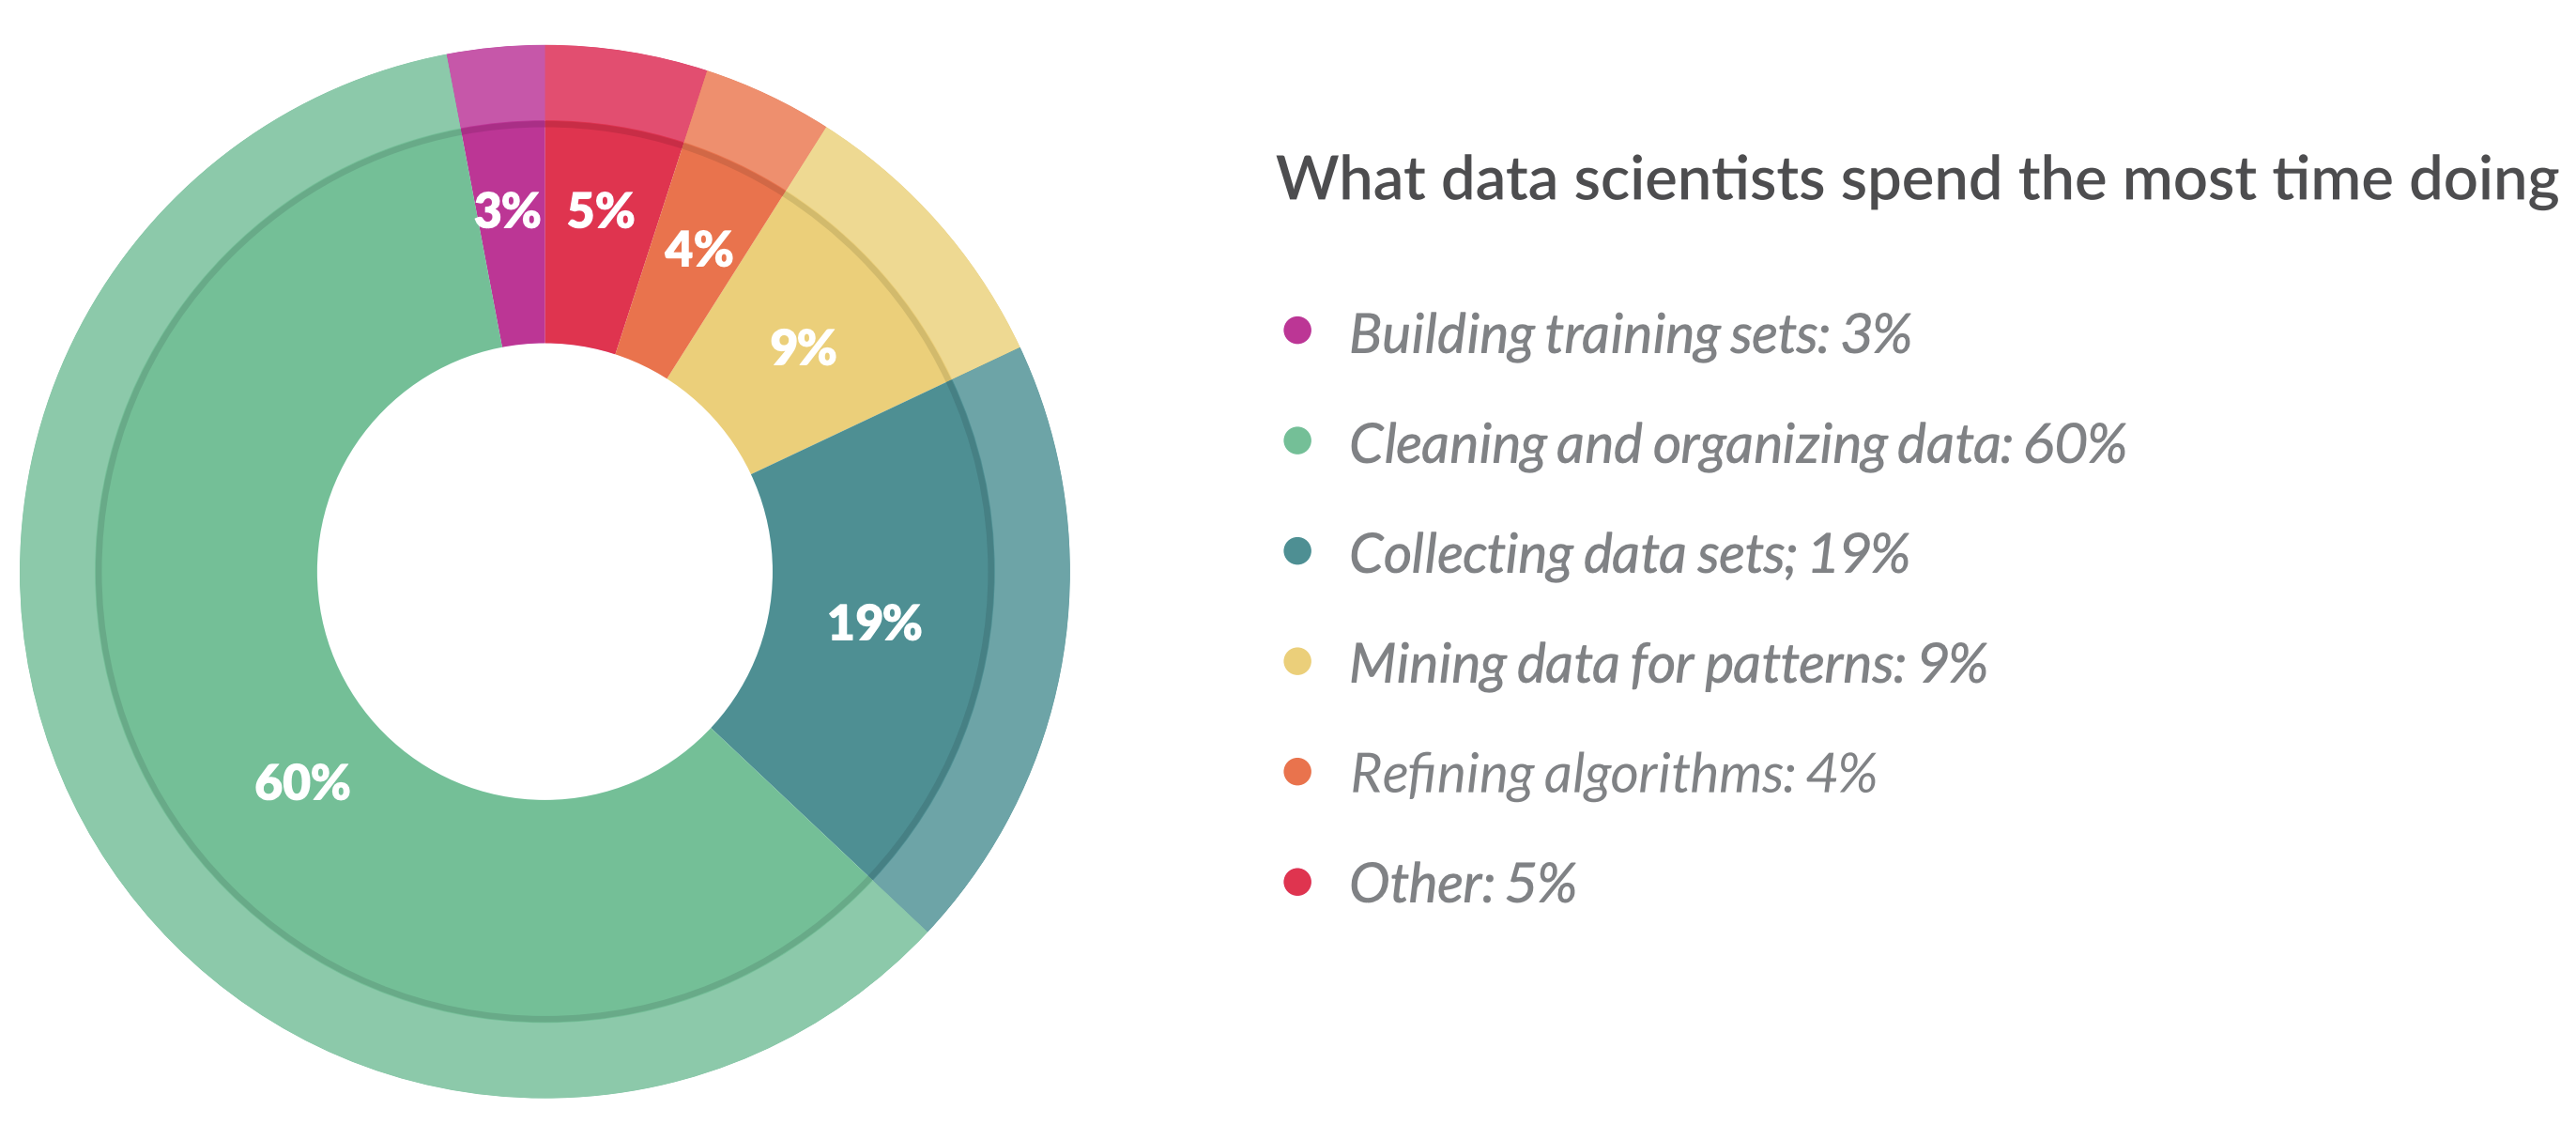
Source: taken from CrowdFlower.
A data scientist is someone who is better at statistics than any software engineer and better at software engineering than any statistician.
- Git/GitHub (give your GitHub handle)
- Tidyverse
- Data visualization (ggplot2, shiny)
- SQL databases (PostgreSQL)
- Rcpp, parallel computing
- HPC (if you use Hoffman2)
- Cloud computing (GCP, AWS?, Azure?)
- Deep learing with Keras+TensorFlow+GPU (PyTorch and Caffe are friendlier for research)
-
Frontend development (shiny, web app)
-
Make your GitHub repo
biostat-203b-2020-winterpublic (after Mar 21) and show your work to back your resume. Feel free to modify the reports even after this course. You can make your GitHub repository into a webpage by using GitHub Pages. - Use these tools in your daily work: use Git/GitHub for all your homework and research projects, write weekly research report using RMarkdown, give presentation using ggplot2 and Shiny, write blog/tutorial, …
What’s not covered
-
Machine/statistical learning methods. Familiar with methods in Elements of Statistical Learning and software, e.g., scikit-learn. Biostat 285 (Advanced Topics: Recent Developments) in 2020 spring quarter.
For non-statistician/biostatistician, I recommend An Introduction to Statistical Learning: With Applications in R, which is less technical and more application focused.
-
Algorithms. Spring quarter’s Biostat 257 will cover numerical linear algebra and numerical optimization algorithms.
-
Public health applications.
-
Be open to languages. Python is a more generic programming language and widely adopted in data science. JavaScript is dominant in web applications. Scala is popular for implementing distributed programs. Julia is attractive for high performance scientific computing.